Rob_Miller
Excel Case Study - Furniture Sales
Project Summary
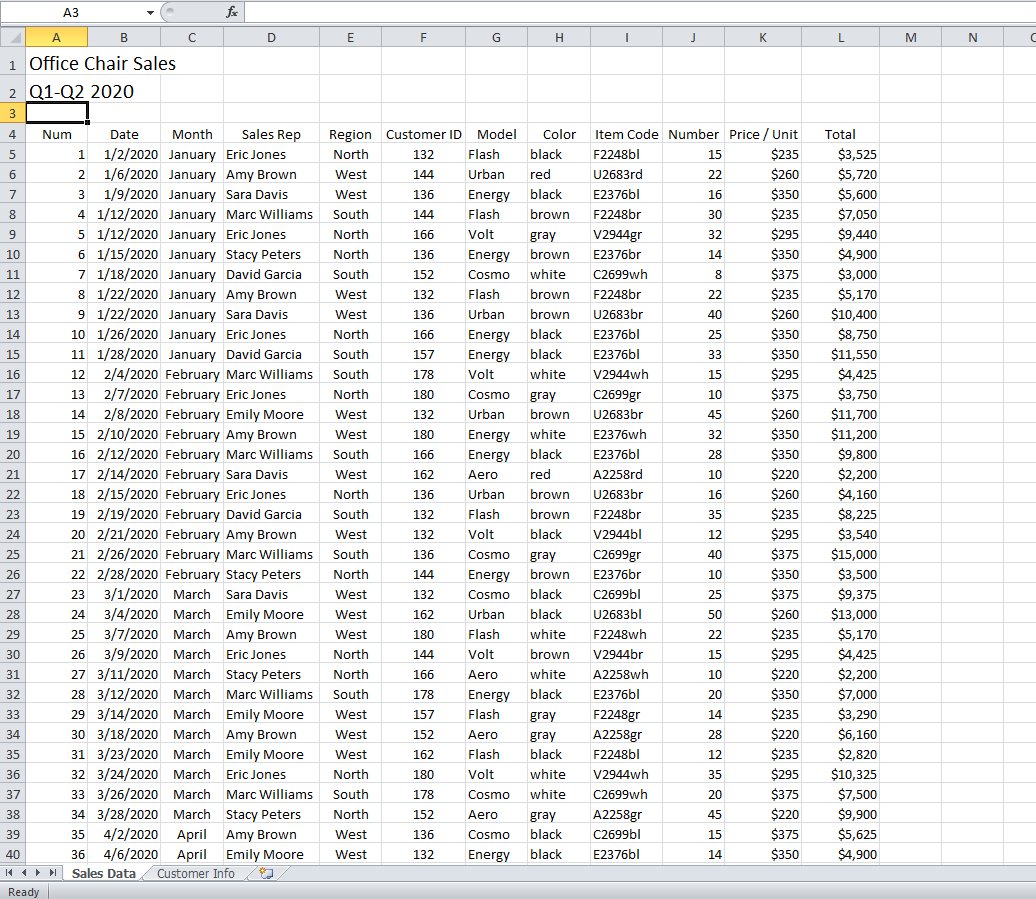
For this guided project, I portrayed role of a junior data analyst for a furniture company. I was given an unprocessed data file via Excel titled Office Chair Sales as seen in Figure 1. The first outcome of this assignment was to assess two .CSV files for organization and readability. Second, pertinent information regarding sales discounts and price was added to the spreadsheet. The final outcome was to summarize data into one spreadsheet using VLOOKUP allowing for easy accessibility for users.
The step by step process used for this project is described below.
Figure 1 The initial .CSV file presented at the start of the project.
Outcome One- Assessing for Organization and Readability
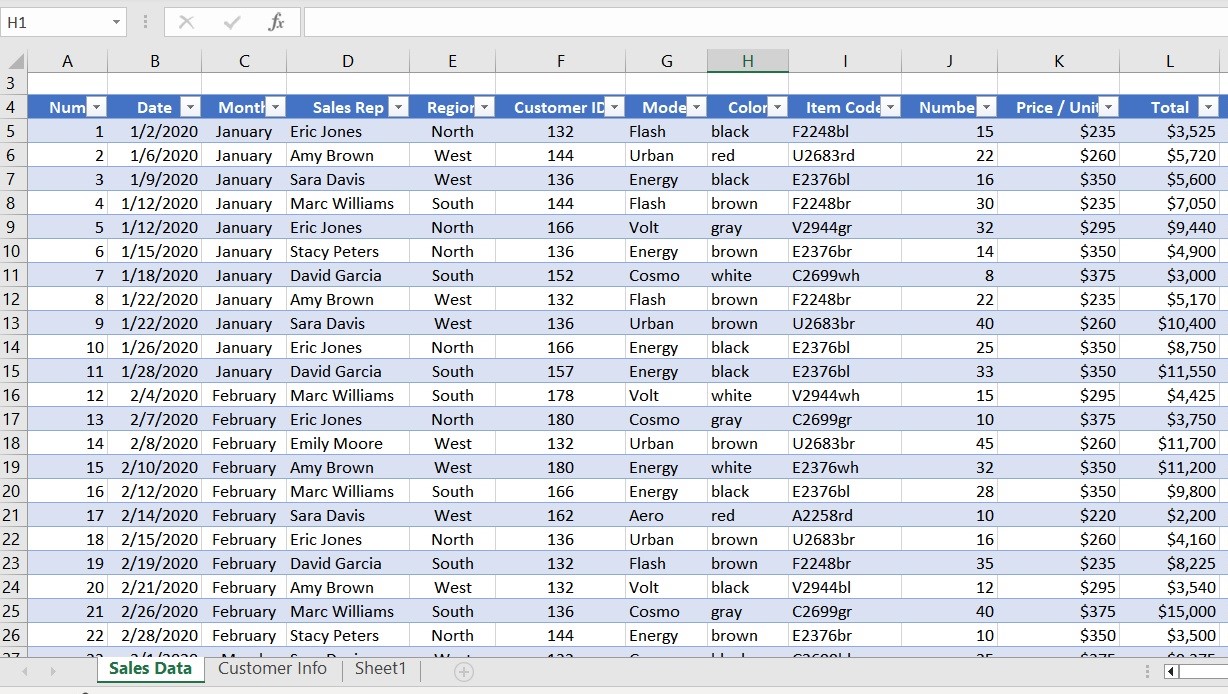
Filters were applied to the column headers to improve data accessibility within the spreadsheet. Filters include, but are not limited to, customer name, total sales by region, or by total sales per date. After the filters were added, the colors were automatically updated to the spreadsheet, improving the overall readability of the file.
Figure 2 The Excel file with added filters.
Outcome Two- Discount Data Input
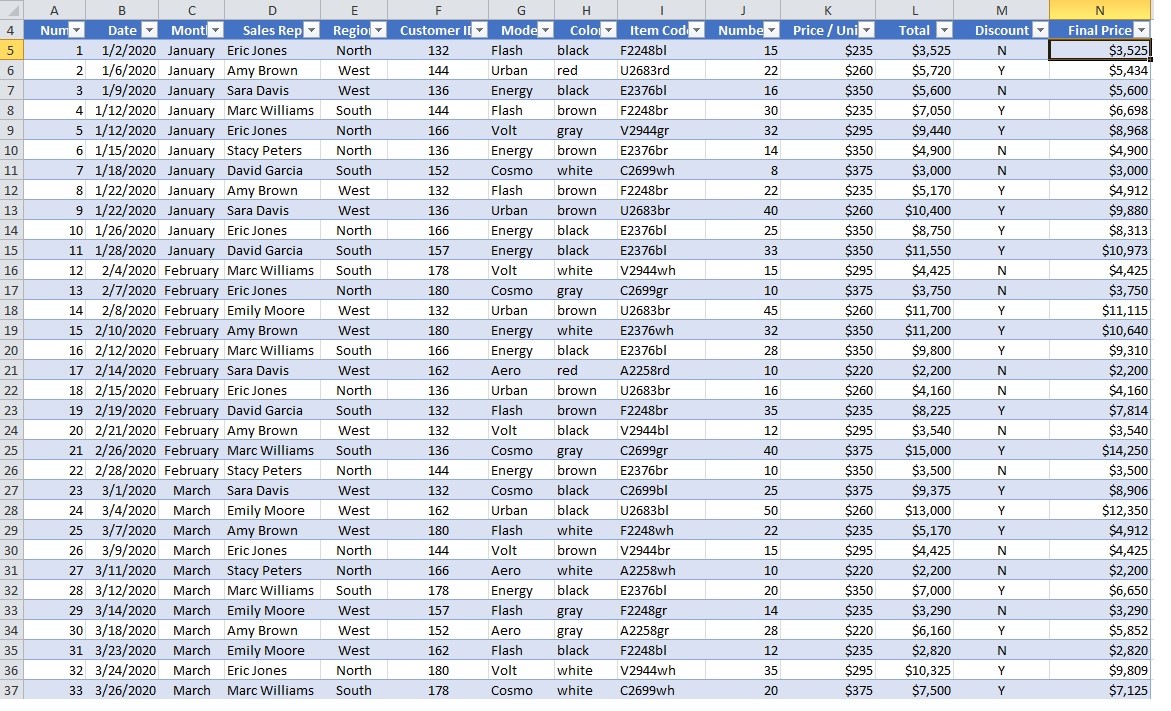
The company used for this project offered a 5% discount if the customer purchased twenty or more chairs. One additional columns was added to the spreadsheet to include information on if the discount was applied. The IF function was applied to the Discount column. This function automatically checks the number of chairs sold in the Number column and applies a Y or N depending if the twenty chair discount condition was met.
IF Function Code
=IF(L5>=20,"Y","N")
Figure 3 The Excel file after the Discount column was added and IF function was applied.

Next, I added a Final Price column that reflects the final price of the purchase. An additional IF function was added to automatically checks the Number column and applies the discount if the number meets or exceeds twenty. The 5% discount is then automatically reflected in the purchase price column.
IF Function Code =IF(L5>=20,0.95*N5,N5)
Figure 4 The Excel file after the Final Price column was added and IF function was applied.
Outcome Three- VLOOKUP
In order to make the data accessible in one spreadsheet, information from the second file titled Customer ID Information was added into two columns in the main spreadsheet. Column G displays the Company Name and Column H lists the Customer Name. The VLOOKUP function was added to the Company and Customer Name columns so the corresponding data would automatically filter into the main spreadsheet.
VLOOKUP Function Code added to column ‘Company Name’ =VLOOKUP(F5,'Customer Info'!$A$4:$C$12,2,FALSE)
VLOOKUP Function Code added to column ‘Customer Name’ =VLOOKUP(F5,'Customer Info'!$A$4:$C$12,3,FALSE)
Figure 5 The Customer ID Information file.
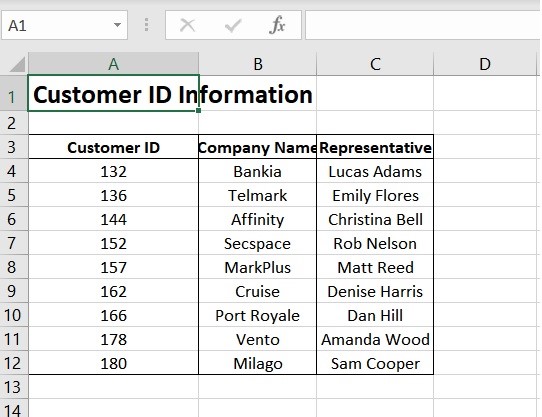
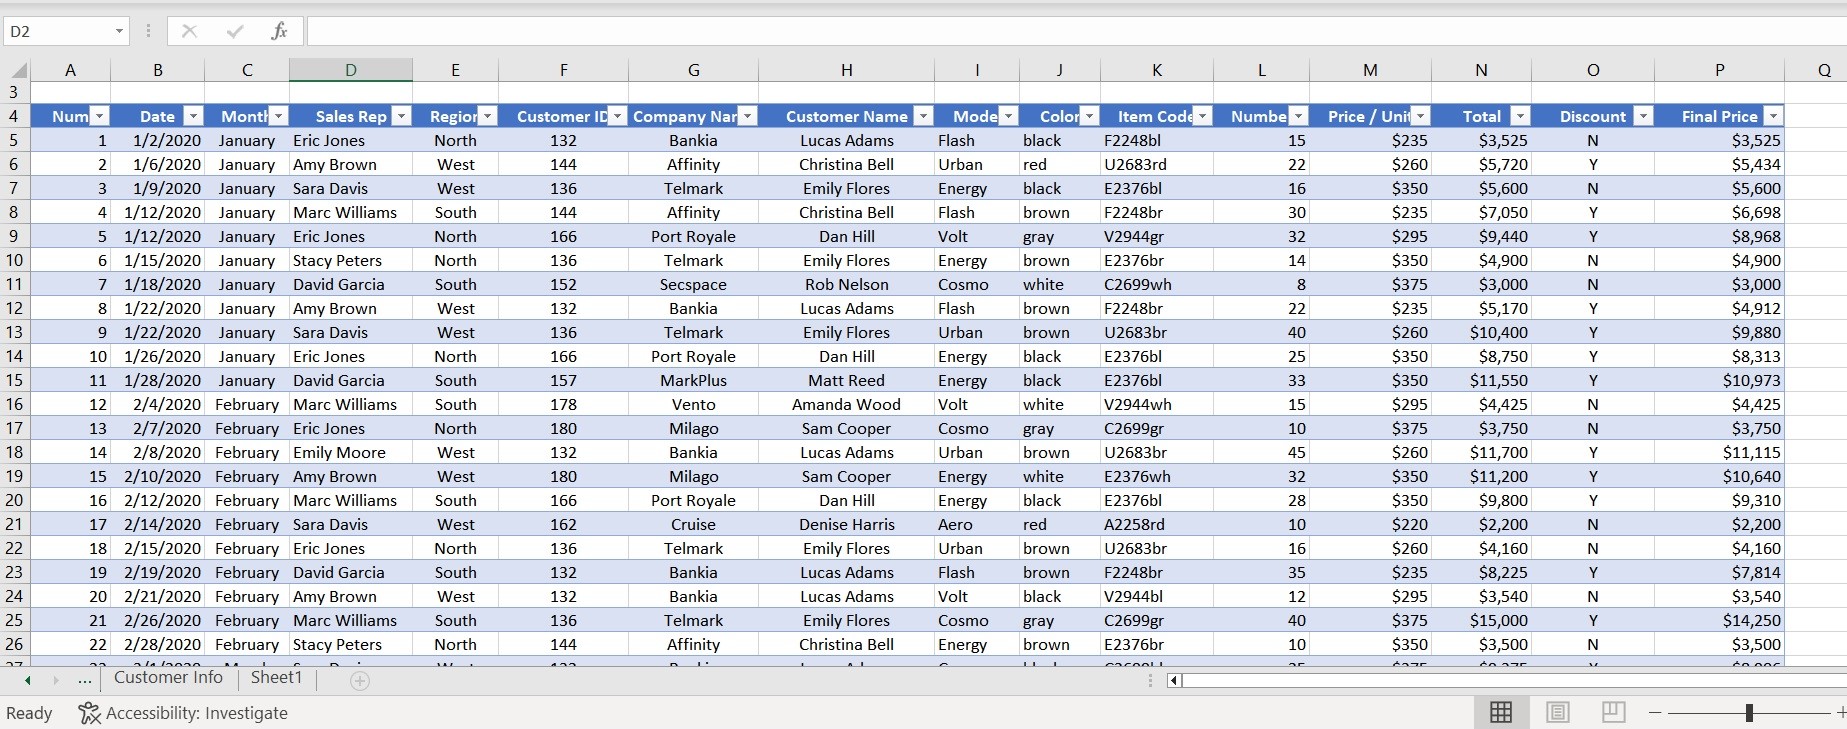
Figure 6 The finalized spreadsheet.
Pivot Tables
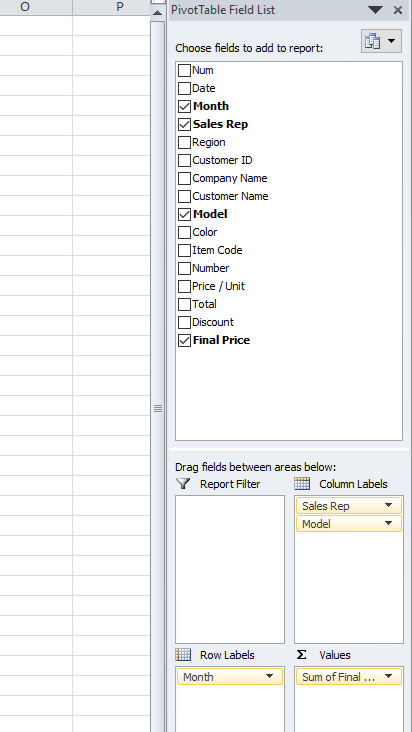
Pivot Tables can be applied to this spreadsheet to quickly and easily filter data to create new tables and graphs by using the PivotTable Field List. This list is seen in Figure 7.
Figure 7 PivotTable Field List.
Examples of new data tables and graphs created using PivotTables are seen below in Figures 8 and 9.
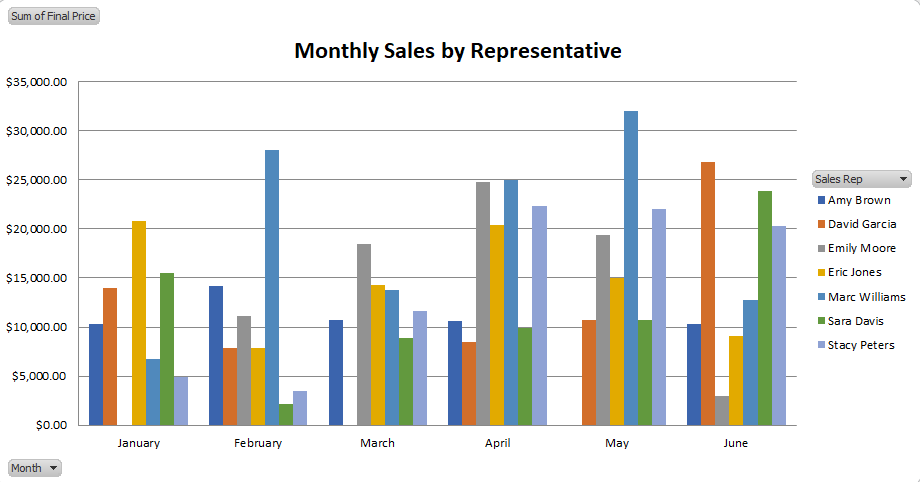
Figure 8 Summary table of Monthly Sales by Representative.

Figure 9 Pivot table graph of Monthly Sales by Representative.